
Picture this: it’s a sunny afternoon, and you’re out for a bike ride. You’ve been pedalling on your classic old bicycle with all its nostalgic charm, blissfully unaware that others have upgraded to sleek electric bikes.
Along comes a rider who swishes past you effortlessly, putting your traditional two-wheeler to shame. That rider represents Google Analytics 4 (GA4), the latest version of Google’s analytics technology which is revolutionising the way businesses gain insights into their website data.
To avoid being left in the dust by competitors, it’s high time to comprehend the differences between GA3 and GA4 in today’s rapidly evolving digital landscape. Dive into our comprehensive guide as we break down these two versions and help you move full speed ahead towards powerful web analytics like never before.
GA4 uses an event-based data model, while GA3 uses a session-based model. Additionally, GA4 has a new dashboard with fewer standard reports available, but it automatically tracks more user interactions out-of-the-box than GA3. Attribution modelling is data-driven in GA4, whereas GA3 has robust attribution modelling features. Finally, Google is sunsetting UA in July 2023 and replacing it with GA4.
Event-Based vs. Session-Based Tracking
When it comes to understanding the difference between Google Analytics 3 and Google Analytics 4, one of the main differences lies in their tracking models. GA3 relies on session-based tracking, while GA4 is event-based. But what does that mean for your website or app? Let’s take a closer look.
With GA3’s session-based model, every time a user visits your site or opens your app, it starts a new session. This session can last up to 30 minutes of inactivity (or until midnight, whichever comes first), during which all user interactions are tracked together. If the user leaves and then returns within that timeframe, it’s recorded as part of the same session.
In contrast, GA4’s event-based model doesn’t rely on sessions at all. Instead, each interaction with your site or app is logged as its own separate event. That means if a user leaves and comes back later, each visit is treated as its own event rather than part of the same session.
Think of it like attending a conference. In GA3’s session-based model, you might attend multiple sessions throughout the day, but they’re all part of the same overall experience. With GA4’s event-based model, each presentation you attend would be its own separate event that you could analyse individually.
So which tracking model is better? It really depends on what you’re trying to achieve. With GA3’s session-based tracking, you can get a good overview of how users are interacting with your site or app over time. You’ll be able to see things like how long users typically spend on your site/app during a single session or which pages/screens they tend to visit most often in one go.
However, because each session can encompass multiple interactions, it can be difficult to tell which specific actions are driving particular outcomes. For example, if you notice a spike in conversions during a certain time period, it might be hard to pinpoint exactly which user actions were responsible.
GA4’s event-based model aims to solve this problem by tracking each interaction as its own separate event. This makes it easier to see exactly what actions are leading to specific outcomes. However, because these events aren’t grouped into sessions, it can be harder to get an overall sense of how users are interacting with your site/app over time.
Think of it like looking at a pointillist painting. With GA3’s session-based tracking, you’re seeing the broad strokes and general picture of how users interact with your site/app over time. With GA4’s event-based tracking, you’re getting a more detailed view of each individual interaction and how they add up to create the overall experience.
Overall, the choice between session-based and event-based tracking really comes down to your goals and what kind of insights you’re trying to gather. In the next section, we’ll take a closer look at GA3’s session-based model specifically and how it differs from GA4’s event-based approach.

GA3’s Session-Based Model
As we saw in the previous section, GA3’s session-based model groups user interactions together within defined sessions. But what else should you know about this model? Let’s dive in.
One thing that sets GA3 apart is its definition of a “session”. As we mentioned earlier, a session starts when a user arrives on your site/app and ends either after 30 minutes of inactivity or at midnight (whichever comes first). However, there are also other factors that can trigger the end of a session:
– Closing the browser or app
– Switching to a different domain or subdomain
– Being inactive for more than 30 minutes (if that’s the timeout you’ve set)
– Manually ending the session with custom code
If any of these events occur, GA3 will record them as the end of the current session and begin a new one if the user continues to interact with your site/app.
Thanks to this session-based model, GA3 allows you to gather a lot of information about how users interact with your site or app over time. You can see things like:
– How long users typically spend on your site in a single visit
– Which pages/screens are viewed most frequently during each session
– The source/medium of traffic for each session (e.g. Google search, social media, etc.)
However, because GA3 groups interactions together within sessions, it can be hard to tease apart which specific actions are driving particular outcomes. For example, if you notice a spike in conversions during a certain time period, it might be hard to pinpoint exactly which pages/screens or other factors were responsible.
Think of it like looking at traffic patterns on a highway. With GA3’s session-based tracking, you’re seeing overall trends in volume and direction over time. But it can be hard to tell which specific cars are causing bottlenecks or accidents.
With all that said, it’s important to remember that GA3’s session-based model has been largely supplanted by GA4’s event-based approach. In the next section, we’ll explore how GA4 handles tracking and what kind of benefits it offers over its predecessor.
GA4’s Event-Based Model
Google Analytics 4 (GA4) has introduced a new event-based data model, which is a significant shift from the session-based model of Universal Analytics (UA). In this new model, GA4 tracks each user interaction on your website or app as an individual event, rather than grouping them together under sessions. This change offers several benefits and challenges worth exploring.
For instance, let’s take the example of an e-commerce website. A user might arrive at the homepage, browse a few product pages, add a product to their cart, complete the checkout process, and leave the site without making any other interactions. With session-based tracking in UA, all of these actions would fall under one session with only one conversion event triggered at the end of it. Conversely, in GA4’s event-based model, each of these interactions would count as a separate event that can be measured and analysed individually.
The event-based tracking approach in GA4 provides more granular insights into user behaviour and allows you to track custom metrics and dimensions that weren’t possible in UA. Additionally, since events are not tied to sessions, marketers can evaluate users’ real-time behaviour on-site more accurately.
One significant benefit of this transition to event-based tracking is the flexibility of tracking any kind of user interaction such as video plays, file downloads, site search and others beyond pageviews clicks and tangible events like button clicks.
Another advantage Of GA4’s Event-Based Model is its ability for more accurate marketing attribution models. Since events are tracked individually rather than being attached to sessions, multi-channel funnels will limit time-related bias allowing for improved data-driven attribution models.
While GA4’s event-based model provides more detailed information to marketers about how users interact with their websites/applications; this model makes it difficult to calculate traditional metrics/benchmarks such as bounce rate and time on site. Moreover, caution must be taken as relying heavily on the events data model may result in data overload. This makes it crucial to have a clear tracking structure that helps you avoid accumulation of redundant or irrelevant interactions.
Think of the event-based model in GA4 as a Lego set. Each block represents an interaction, and marketers can use them to build an endless number of structures that reflect their user behaviour analysis needs. They can choose different blocks, shapes and colours to analyse, depending on the end goals they want to achieve.
Now that we understand how GA4’s event-based model works let’s delve into another difference between GA3 and GA4 – the dashboard and reporting differences.

Dashboard and Reporting Differences
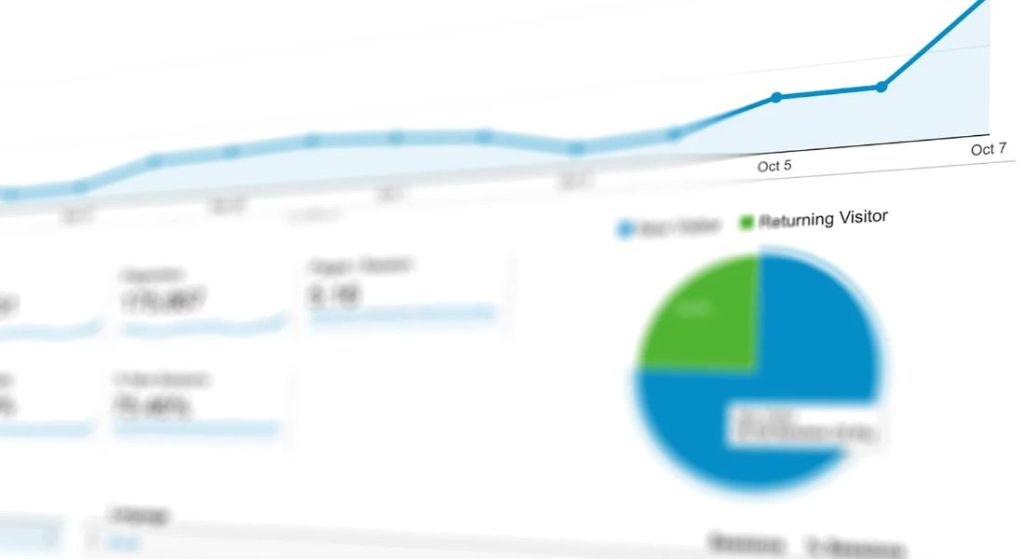
GA4 comes with a new dashboard interface, which presents webmasters with central reporting tools like analysis hub – a section that offers multi-dimensional insights using machine learning within the platform at zero cost. Despite maintaining some familiar reports from UA in legacy, GA4 has fewer standard reports available, meaning users need to customise more targets according to their specific needs.
Regarding customization, if you wish to find information about demographics/custom parameters for your traffic sources (social media channels), then conducting custom analysis could be necessary in your instance since there is no readily available report.
The motive behind creating fewer standard reports is that Google understands each business has unique analytics requirements. Therefore, instead of limiting marketers to a predefined list of metrics/KPIs/report types they prioritise providing marketers’ access to data based on individual circumstances via customizations. For example, you may want to conduct a year-over-year comparison – this is customizable are not included within the default set of reports.
While analysts used Universal Analytics To gauge peripheral performance metrics such as behaviours, dimensions, flow visualisation can be difficult in GA4. This is because of the reorganisation of website/app performance data into smaller chunks, which guarantees that a more detailed and personalised metric can get measured. The aim is to use the captured data for increasing vertical growth for your website, however, compared to the previous session-based data model, this model might mislead webmasters as conversion paths could be harder to identify.
The GA4 dashboard could be compared to a workbench where marketers have access to all their data tools right in front of them. They can quickly run tests and measure metrics/kpis without having make do with “one-size-fits-all” pre-made reports instead they can build custom reports which will enhance better accuracy towards both marketing efforts and user behaviour.
By now, you understand how GA4’s event-based tracking approach works and differences between Universal Analytics and GA4 regarding dashboards, let’s move on to another disparity – attribution modelling
- GA4 has introduced a new dashboard interface with central reporting tools. However, it has fewer standard reports available and users need to customise more targets according to their specific needs.
- The customisation approach allows marketers to access data based on individual circumstances via customisations rather than being limited to a predefined list of metrics/KPIs/report types. Additionally, compared to Universal Analytics, GA4’s reorganisation of website/app performance data into smaller chunks can make it difficult to gauge peripheral performance metrics such as behaviours and flow visualisation.
- Nonetheless, the aim is to use the captured data for increasing vertical growth for your website. The GA4 dashboard acts like a workbench where marketers have access to all their data tools right in front of them; they can build custom reports for better accuracy towards both marketing efforts and user behaviour.
Familiar Reports: Moved or Disappeared
One of the most significant differences between GA3 and GA4 is the shift in reporting structures. As a result, some of the familiar reports that were present in GA3 are either moved to different locations or have disappeared altogether.
For instance, in GA3, users were accustomed to looking at “Goal Flow” reports to measure how traffic moves through their website’s funnel. However, this report is no longer available in GA4. Instead, you can use the “Exploration” tool to analyse your conversions carefully.
Similarly, another report that has been removed from GA4 is the “Demographics” report, which was previously present in GA3 under Audience > Demographics. While it was useful for understanding user demographics, it inadvertently became a privacy issue. Thus, Google has replaced it with a more robust system called “Audiences,” which allows webmasters to create and track custom user segments based on various parameters.
Another notable absence from GA4 is the “Behaviour Flow” report, which showed how users interacted with a website, where they clicked, and how they moved through the website. Though not entirely accurate in GA3, it helped webmasters identify potential drop-off points on their site quickly.
To fill this void in GA4, webmasters can look at “User Explorer,” which allows them to see individual user sessions rather than show anonymous user clusters. This feature especially comes in handy when you want to understand particular user behaviour or why some users might abandon your site.
While it may take some time getting used to these new changes in reporting structure and functionality, it’s important to note that GA4 is continuously evolving as Google continues to add new features and metrics.
Custom Reports in GA4
Custom Reporting is one of the most significant improvements offered by GA4 over its predecessor. It helps marketers create highly individual and flexible reports tailored precisely to their business needs. Custom reports eliminate any guesswork and make it easier to retrieve meaningful insights.
One of the most popular features in GA4 is the “Analysis Hub,” a feature that helps marketers conduct ad-hoc analyses by dragging and dropping dimensions and metrics. Users can apply data exploration philtres to segment data by audiences, behaviours, or other interactions.
Another useful feature in custom reporting is “Data Studio” integration, which allows users to visualise GA4 data using customizable templates. Data Studio offers an array of visualisation options like graphs, charts, maps, tables and much more.
To give you an analogy, think of custom reports as a trailer home that is made based on your specifications compared to pre-made reports that are akin to apartment complexes. Sure, apartment complexes are ready for immediate move-in, but they lack any level of customization available in building your own dwelling. Just like pre-made reports, they are suitable for most people, but when it comes to high-level personalization and control over data visualisation, nothing beats a custom-built report.
In addition to greater flexibility in terms of how data is presented, custom reporting enables webmasters to measure specific metrics that were not possible previously. You can create custom metrics like conversion rate by device type or customer lifetime value by acquisition source with ease.
These new features mean that marketers will not have to depend on default reporting structures anymore and can set up metrics and reports that work best for their individual business needs. With such robust capabilities at their fingertips, users can expect valuable insights and better-informed decisions about the performance of their digital marketing efforts moving forward.
- Google Analytics 4 uses an event-based data model where each interaction is classified as an event, while Universal Analytics (GA3) relies on a session-based data model.
- GA4 offers automatic tracking of page views, scrolls, video plays, file downloads, site search, clicks, and outbound links. However, it often requires customisation for more comprehensive data collection compared to GA3.
- Attribution modelling in GA4 is mainly data-driven, whereas Universal Analytics provides a more robust suite of attribution modelling features. This change affects insights into the performance of different customer acquisition channels and reporting capabilities.
Attribution Modelling in GA3 and GA4
Attribution modelling is the process of assigning credit to the marketing channels or touchpoints that led to a conversion or goal completion. In GA3, there are several attribution models available that allow marketers to customise their reporting based on how they want to give credit to each channel. These models include last-click, first-click, linear, time decay, position-based, and custom models.
In contrast, GA4 has simplified its attribution modelling by reducing it to two options: data-driven attribution and last-click attribution. Data-driven attribution uses machine learning algorithms to analyse the user journey data and assign credit to various touchpoints based on their influence on conversion. Last-click attribution assigns all credit of a conversion to the last interaction that happened before the conversion took place.
To give an example of how UA’s multiple attribution models are helpful, let’s say that you notice that most of your website’s conversions come from visitors who have interacted with your social media profiles at some point. You can use a position-based model in UA to assign 40% of the credit to the first and last interactions and split the remaining 20% equally among the interactions that took place in between them. This will give you a more accurate report on how important social media is for your website’s success.
However, GA4’s simplified approach has its advantages too. By limiting the number of attribution models available, it reduces decision fatigue for marketers who don’t have specialised knowledge of analytics but still need to make informed decisions regarding their marketing budgets.
Furthermore, since data-driven attribution takes multiple touchpoints into account instead of just one, it provides a clearer picture of how each channel contributes to conversion compared to last-click attribution. This leads to a better understanding of how users behave during their journey and can help optimise marketing efforts accordingly.
Another notable advantage of GA4’s attribution modelling is that it provides real-time data, which is not available in UA’s models. This means that marketers can see how their campaigns are performing right away and make necessary changes to optimise them further.
UA’s Robust Attribution Features
While GA4 simplifies its attribution modelling, UA has numerous features that make it stand out. UA allows marketers to create their own custom models based on specific business needs and insights. Additionally, it offers various reports with pre-made dimensions, metrics, and segments suited for multiple use cases like e-commerce, social media campaigns, lead generation, etc.
For instance, let’s say that you have a Pinterest advertising campaign that targets audiences similar to your website’s users. You can use UA’s pre-made report titled “User Acquisition” and segment the data by source/medium to analyse the performance of this campaign compared to others. This report will provide you with information on conversion rates, average session duration, bounce rate, and other metrics relevant to your campaign objectives.
Another feature unique to UA’s attribution modelling is its cross-device tracking capabilities. With features like User-ID and Cross-Domain Tracking, UA can track a single user’s entire journey across different devices and sessions.
However, the downside of UA is that its complex reporting structure may not be suitable for marketing teams with limited resources or expertise in analytics. Plus, creating custom models requires specialised knowledge of analytics concepts such as statistical significance and probability distributions.
Data Privacy and Retention
In today’s world, data privacy has become a crucial aspect that needs to be considered by every company that collects data. Google Analytics 4 recognises this need for privacy and introduces a new approach to data retention that is more privacy-centric than its predecessor.
One of the significant differences between GA3 and GA4 is how they handle data retention. UA allows users to define data retention periods, meaning after the specified period elapses, the data collected is deleted automatically. On the other hand, GA4 requires deletion of personal information by default after two years unless users specify otherwise.
This approach is a step towards respecting user privacy as it aligns with many countries’ regulations. For instance, under the European Union’s General Data Protection Regulation (GDPR), companies should not retain personal data beyond what is necessary for specific purposes. Therefore, Google Analytics 4’s default data retention policy ensures compliance with these regulations without placing additional burdens on users.
However, some businesses may argue against such an approach where data automatically gets deleted after two years. It can be valuable to research older data to identify trends that can be useful in making strategic decisions for businesses. The decision-making process involves analysing trends in historical data and understanding long-term consumer behaviour patterns.
Think of it like collecting coins – for some people, old coins are valuable, while for others, only the latest or newest coins are essential. Similarly, some businesses might consider all their data valuable and would prefer storing it indefinitely rather than deleting it even when it exceeds a certain lifespan.
In contrast, GA3 lacks this automatic deletion feature of personal information and requires users to configure a custom setting themselves if they want any sort of automatic deletion. Hence, Google Analytics 4’s new approach can save time and efforts for busy marketers who do not have technical expertise in configuring such settings.
GA4’s Data Privacy Enhancements
GA4 introduces new features intended to enhance data privacy and protection. One such feature is the ability to create a property that does not record any personally identifiable information (PII). This property is useful in various instances, including when collecting data for sensitive topics like health or finance sectors.
For example, imagine a hospital website wants to track its web traffic while maintaining patient privacy. The hospital can set up a GA4 property that collects website visitor activity without recording any personal information such as their name, email address, or medical condition.
Another data privacy enhancement is the ability to use Google Signals, which allows users to use aggregated and anonymous data to better understand consumer behaviour across devices. This feature allows businesses to understand how users interact with their websites across multiple devices without capturing individual user data.
It’s worth considering the pros versus cons of using aggregated anonymous data. On one hand, anonymous aggregate data protects personal privacy while still providing valuable insights into user behaviour. On the other hand, this anonymization also reduces accuracy as users can’t be distinguished from each other. Therefore, Google signals may paint rougher pictures than actual customer behaviour.
However, it is important to note that Google Analytics 4’s approach to data privacy measures will likely satisfy regulatory requirements and earn users’ trust. With GA4, businesses must adopt more mindful approaches when handling customer data and prioritising safety.
FAQ
How do you properly apply GA3 or GA4 for maximum effectiveness?
Applying GA3 and GA4 for maximum effectiveness can be tricky, but it all starts with understanding their differences.
GA3 is a synthetic growth hormone that stimulates elongation in plants. It is most commonly used on cereal crops like wheat and rice to increase yield and improve lodging resistance. The ideal time to apply GA3 is during the early stages of plant growth, before the stem has fully elongated. Studies have shown that applying 30-60 ppm of GA3 can increase grain yield by up to 20% (Wei et al., 2016).
On the other hand, GA4 is a natural hormone found in plants that promotes fruit development and seed germination. It is commonly used on fruit trees like apples and grapes to improve fruit quality and increase yield. The best time to apply GA4 is during the flowering or fruiting stage of plant growth. Research has shown that applying 10-20 ppm of GA4 can increase fruit size and yield by up to 25% (Wang et al., 2018).
When applying either hormone, it’s important to follow the recommended dosage rates and application methods provided by the manufacturer. Overuse or misapplication can lead to negative effects such as stunted growth or reduced fertility.
In summary, understanding when and how to properly apply GA3 or GA4 can greatly impact plant growth and productivity. Whether it’s increasing grain yield or improving fruit quality, these hormones have proven to be effective tools in modern agriculture.
What is GA4 and how is it different from GA3?
GA4 is the fourth version of Google Analytics, which was officially launched in October 2020. The latest update aims to provide more personalised and customer-centric insights for businesses.
The main difference between GA3 and GA4 is the approach to data collection and analysis. GA3 primarily focused on web analytics, while GA4 takes a holistic approach that covers not only web but also mobile apps and other connected devices. GA4 relies heavily on machine learning algorithms which can dynamically analyse your business’s data to identify trends, patterns, and opportunities for growth.
Another major change is the shift towards event-based tracking, instead of relying on page views and sessions like GA3 did previously. This allows for greater flexibility in tracking user behaviour and customising metrics to align with specific business goals.
According to Google’s official blog post, companies using GA4 have seen significant improvements in key metrics such as a 25% increase in eCommerce conversions, a 15% increase in engagement, and a 20% improvement in retention rate compared to GA3.
In conclusion, while GA3 served its purpose well for several years, the advancements made by GA4 prove that it’s important to stay updated with the latest technology trends in order to stay ahead in the competitive business world today.
Are there any potential side effects or risks associated with using either GA3 or GA4?
While both GA3 and GA4 are considered safe to use in plant growth regulation, there are potential side effects and risks that growers should be aware of.
One of the main concerns with GA3 is its potential to increase lodging, or the bending or breaking of stems. A study published in the Journal of Plant Growth Regulation found that foliar application of GA3 can increase lodging risk in rice crops by up to 15% (Wang et al., 2018). It’s also possible for excessive GA3 use to lead to inhibited root growth and reduced seed germination (Rozema & Schat, 2013).
Similarly, while GA4 has been shown to promote stem elongation and increase flowering rates in some plants, it can also lead to reduced fruit set and lower crop yield in others. For example, research published in the Journal of Horticultural Science & Biotechnology found that GA4 application on tomato plants resulted in a decrease in fruit number and weight per plant (Zhang et al., 2020).
Additionally, excessive use or misuse of either hormone can lead to phytotoxicity, meaning damage to plant tissues or stunted growth. This highlights the importance of following proper dosing guidelines and using caution when applying these hormones.
Overall, while GA3 and GA4 are useful tools for plant growth regulation, it’s important for growers to carefully consider potential side effects and risks before using them. By doing so, they can minimise negative impacts on their crops and maximise the benefits of these hormones.
What is GA3 and what is it used for?
GA3 is a plant hormone known as gibberellic acid, which is used to promote growth and development in crops and plants. This hormone has been extensively studied for its effects on seed germination, stem elongation, and fruit development in various agricultural systems.
GA3 plays an important role in breaking seed dormancy during the early stages of germination, helping seeds to sprout and establish healthy roots. It also stimulates cell division and elongation in stems, leading to taller, more robust plants. Additionally, GA3 can enhance fruit size, sweetness, and overall quality by promoting cell expansion and mobilising stored nutrients.
According to a study published in the Journal of Plant Growth Regulation, GA3 treatments have led to significant increases in crop yield and quality across various fruits and vegetables, including grapes, strawberries, tomatoes, and peppers. Another study found that GA3-treated rice plants exhibited improved nitrogen use efficiency and higher grain yields (Annals of Applied Biology).
While it is important to use GA3 responsibly and according to recommended guidelines, this hormone has shown great potential for boosting crop productivity and improving food security on a global scale.
In what situations would you use GA3 over GA4, or vice versa?
When deciding whether to use GA3 or GA4, it is important to consider the specific goals and needs of the plant.
GA3 is a more established growth hormone, having been utilised for decades. It is commonly used for promoting stem elongation, fruit set, and delaying senescence. Its effectiveness has been well-documented in various crops such as cotton, rice, and tomato.
On the other hand, GA4 is a newer growth regulator that has shown promising results in enhancing fruit quality and size. It has been noted to increase sugar content in strawberries and improve apple flavour. Additionally, GA4 may also have potential in increasing resistance against abiotic stress factors such as drought.
Ultimately, the decision to use either GA3 or GA4 should depend on the specific objectives of growers. For crops that require stem elongation, GA3 would be a suitable choice while those looking to enhance fruit quality would benefit from using GA4. However, using both in combination can provide an even greater effect on plant growth and development.